Financial Charting Solutions
Deliver high-performance, real-time multi-asset charting across asset classes for financial institutions.

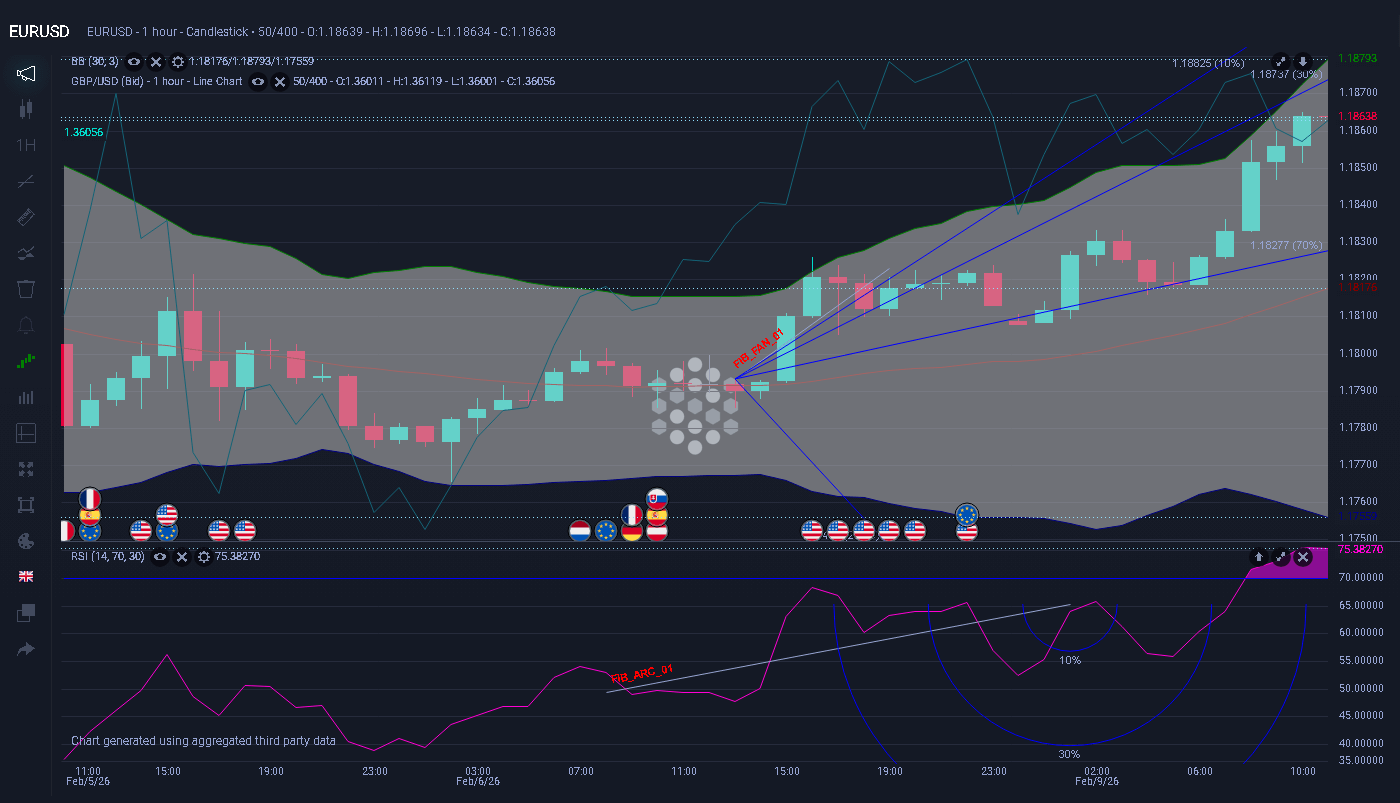
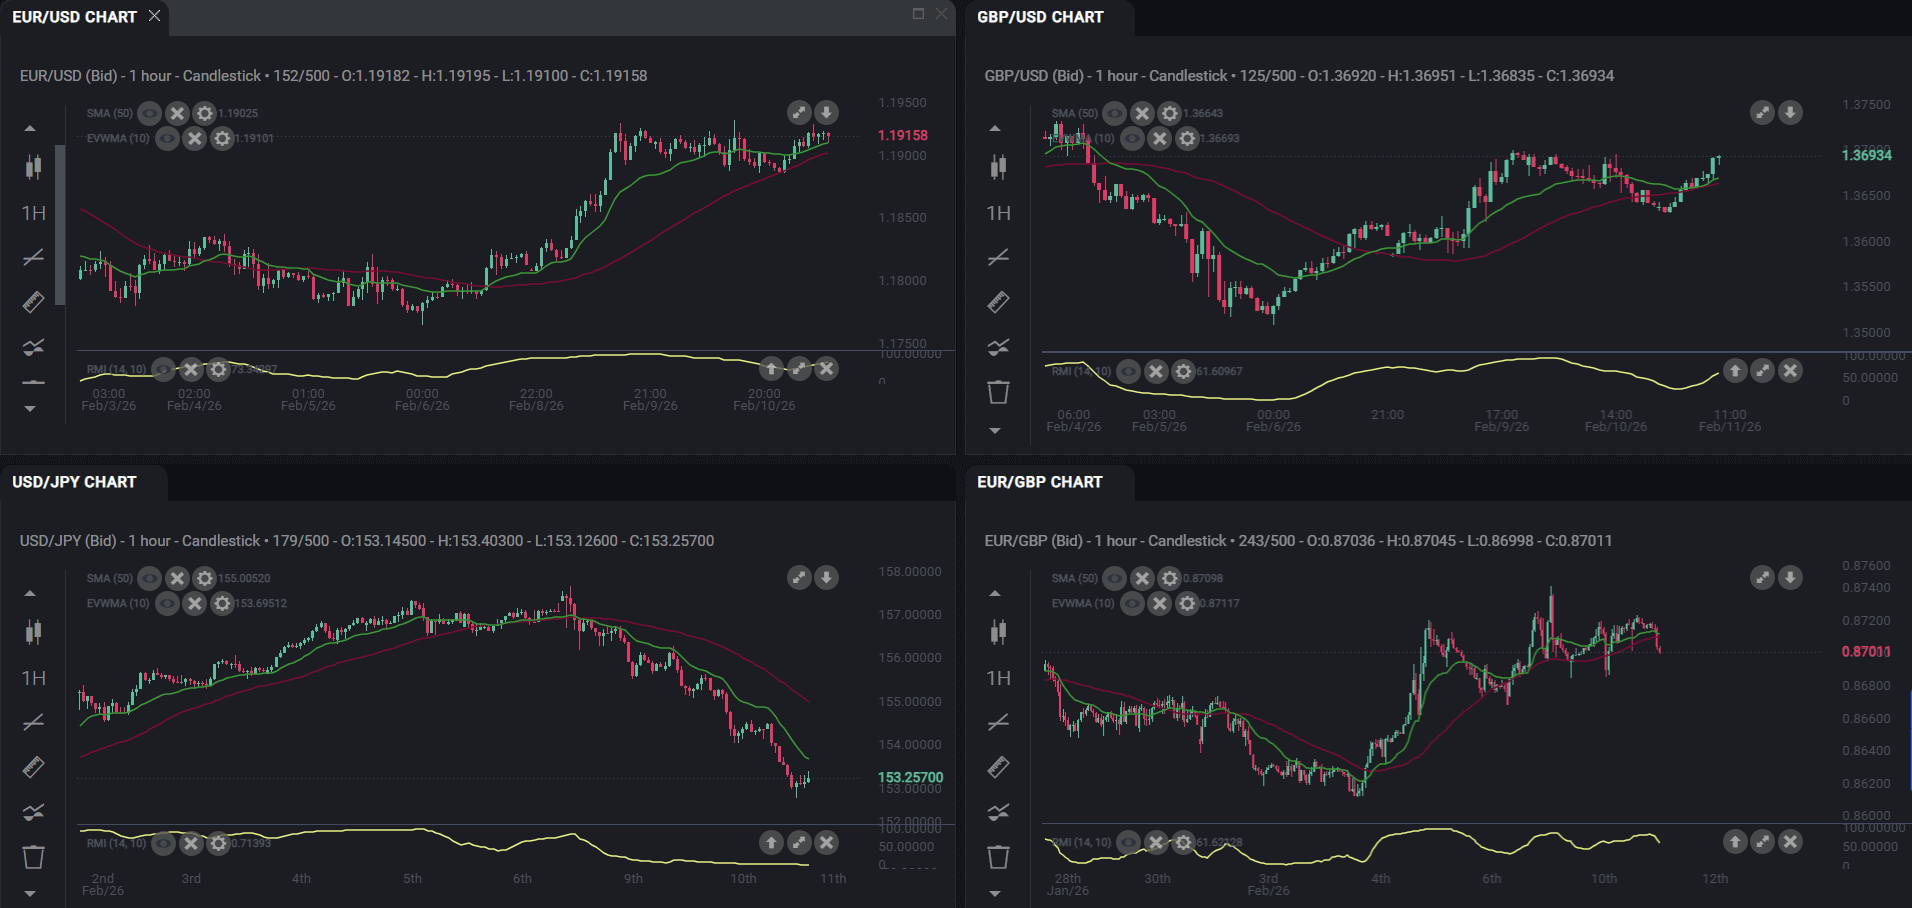
Netdania’s institutional charting software brings analytical depth to trading and research environments. It supports multi-timeframe analysis, overlay comparisons, and advanced technical studies, from moving averages to volatility indicators, revealing market trends instantly.
The low-latency engine ensures real-time accuracy, while responsive layouts adapt seamlessly across desktop, web, mobile and single-dealer platforms. In addition, Netdania delivers native mobile charting capabilities, ensuring a fully optimised experience across iOS and Android devices without compromising performance or analytical depth.
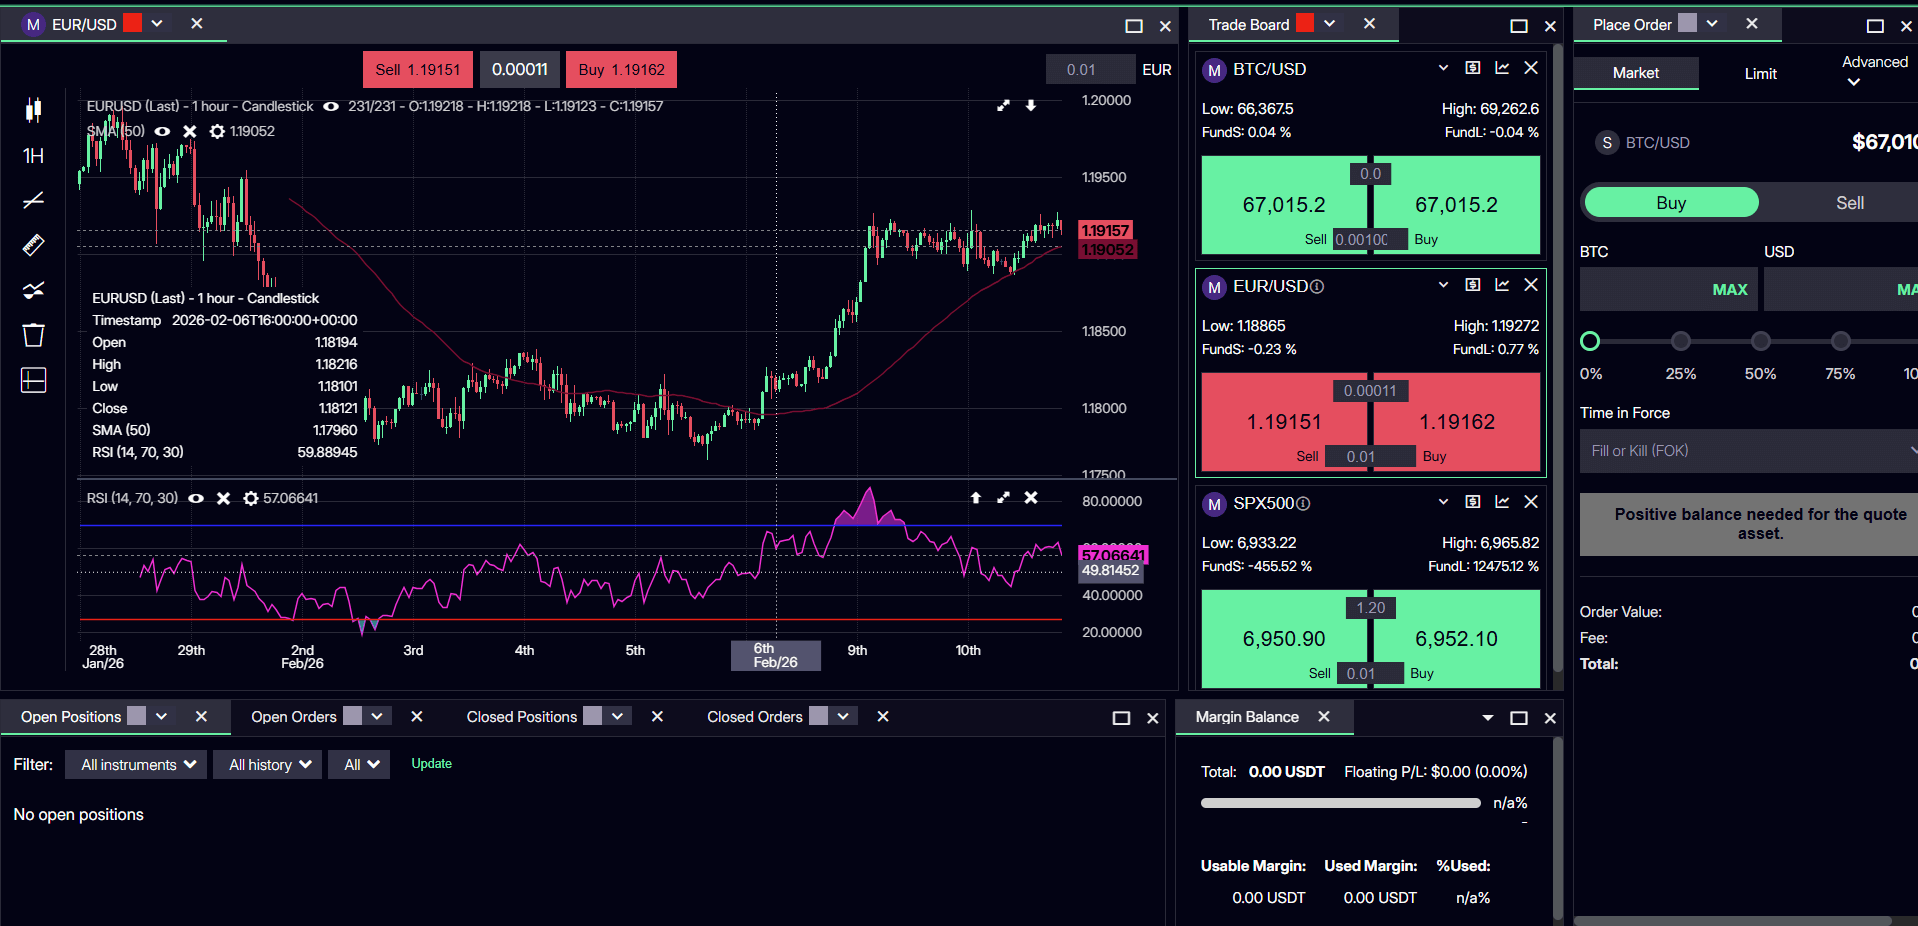
Fully API-driven and white-label ready, it integrates with trading terminals, OMS/PMS systems, or analytics dashboards. Beyond white-labelling, Netdania’s charting is highly customisable and bespoke, designed to fit the individual branding, workflow, and functional requirements of each platform it is integrated into. Users can trade and manage orders and positions directly from the chart, enabling a fully interactive and execution-ready experience.
By combining visual clarity, speed, scalability, and execution capability, Netdania transforms market complexity into intuitive, actionable insights. As the go-to provider of financial charting for banks and financial institutions, Netdania delivers trusted, high-performance solutions at scale.
Built on standards. Backed by proof.
Our certifications confirm independently assessed controls and alignment with recognised industry frameworks.
Heading
We turn bold ideas into measurable results. By combining insight, execution, and technology, we deliver solutions that make transformation not just achievable, but repeatable.


